Our Products
Our Solutions
Resources
ABOUT US
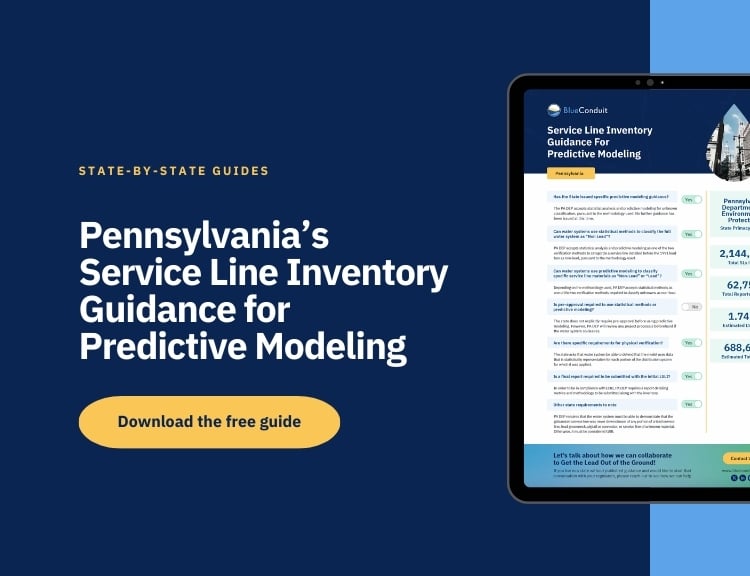
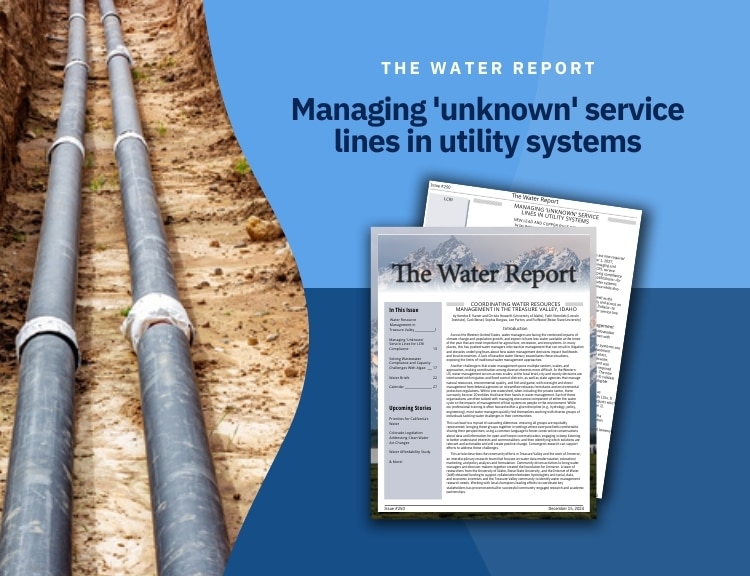
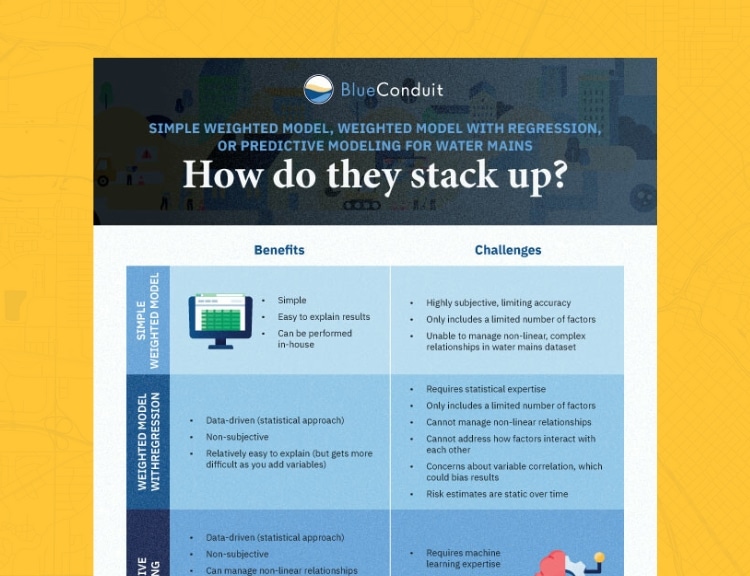
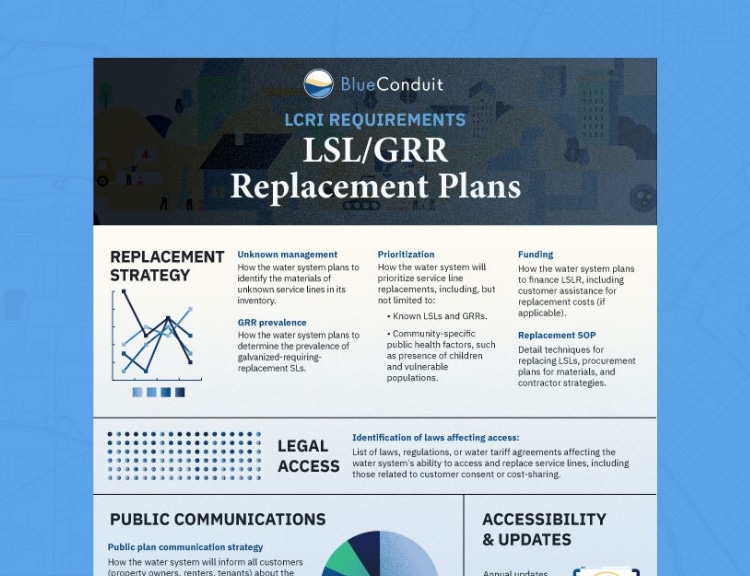
Explore our guides and take your water infrastructure management to the next level.
GUIDES
Get the latest updates and industry insights delivered straight to your inbox.