

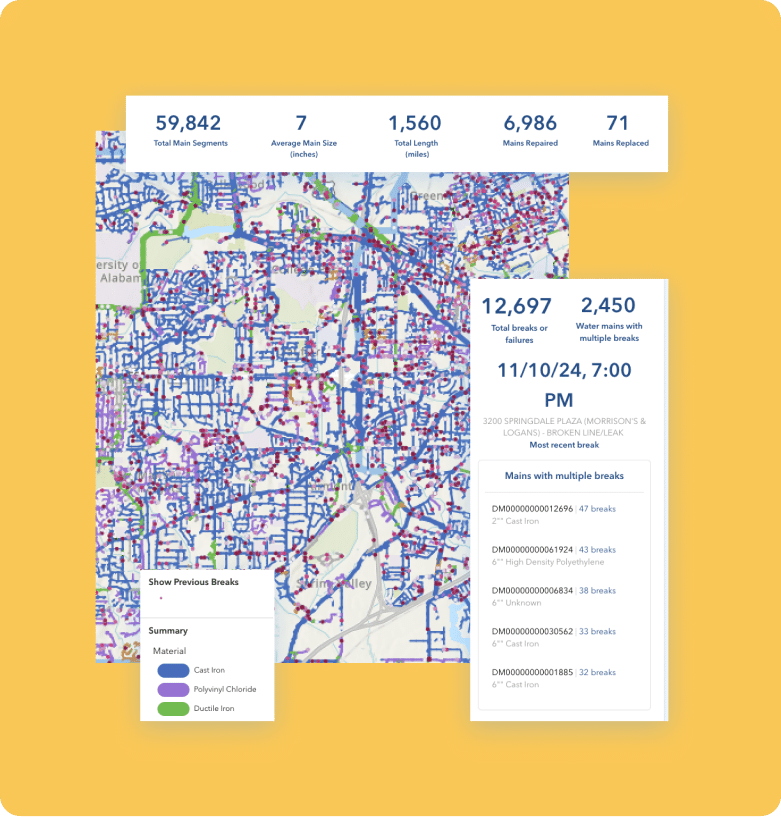
Data dashboard
View and dynamically interact with your up-to-date water mains dataset:
View and dynamically interact with your up-to-date water mains dataset:
- Interactive map view & tools
- Interactive table view & tools
- System health indicators
- Break history metrics
- Interactive charts
- Data layers include, but are not limited to:
- Water main data
- Break history
- Criticality
- Filter and sort by multiple factors including, but not limited to:
- Diameter
- Material
- Install date
- Criticality
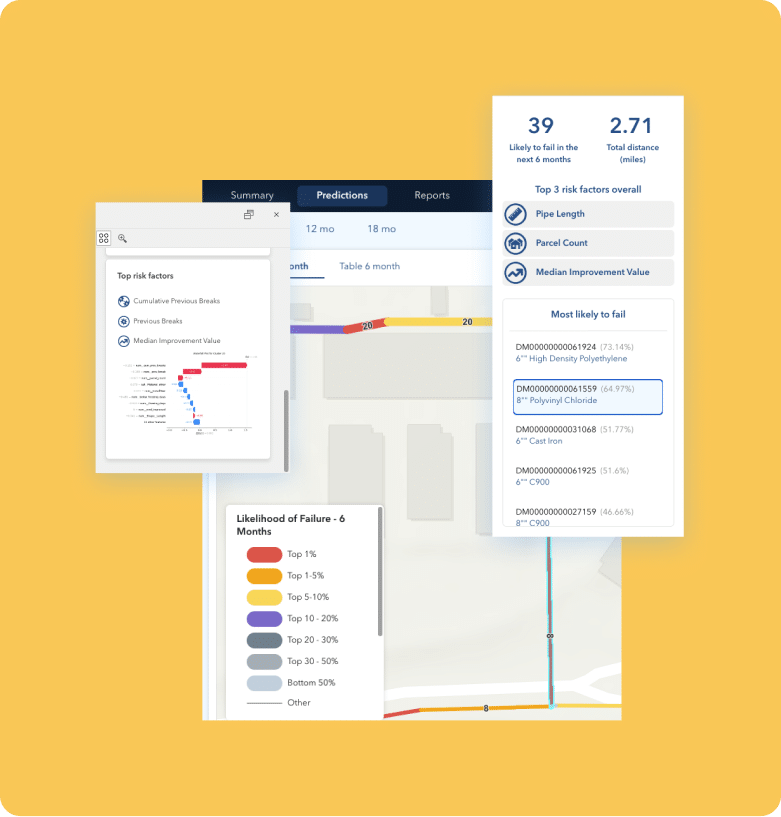
Predictive modeling
Enhance your understanding of water main risk with high accuracy likelihood of failure predictions:
Enhance your understanding of water main risk with high accuracy likelihood of failure predictions:
- Likelihood of failure (LoF) predictions for every water main for multiple timeframes using BlueConduit’s state-of-the-art machine learning models
- Ongoing, dynamic prediction updates
- Prediction explainability, systemwide
- Prediction explainability, by water main
Predictive dashboard
View and interact with your dynamically up-to-date water mains likelihood of failure predictions
View and interact with your dynamically up-to-date water mains likelihood of failure predictions
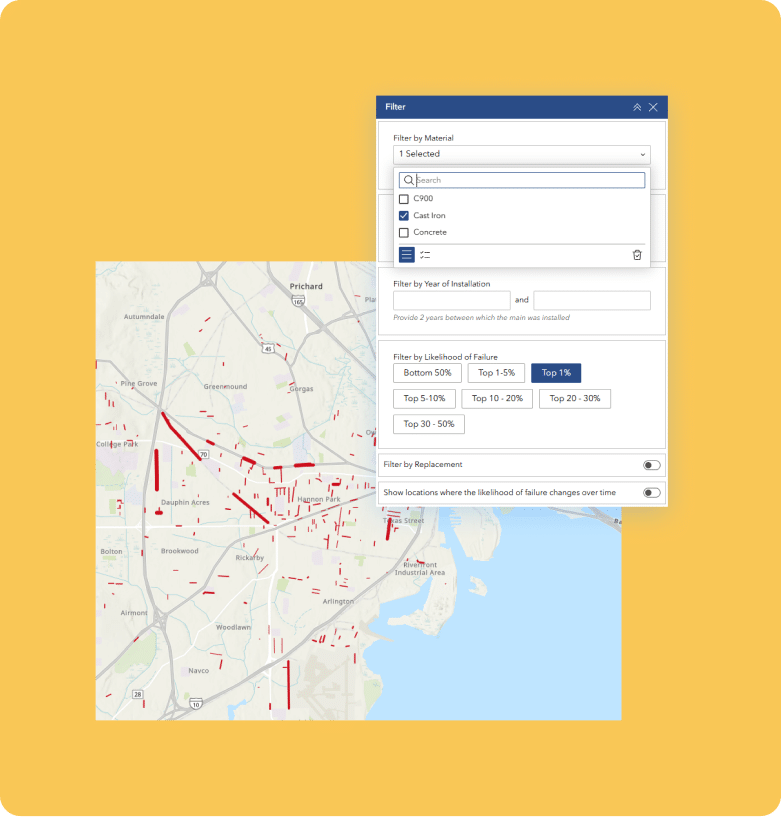
- Predictions with explainability, bucketed by LoF percentile (Top 1%, 5%, etc)
- Prediction change-over-time assessment and explainability
- Break history metrics (interact, filter, sort)
- Map view (interact, filter, sort)
- Table view (interact, filter, sort, export)
- Filter by multiple factors including, but not limited to:
- Diameter
- Material
- Install date
- Criticality
- Compare predictions to multiple baseline models including:
- Historical breaks only
- Water main age only
- M-77 LoF weighted model, with weighted assigned via machine learning models
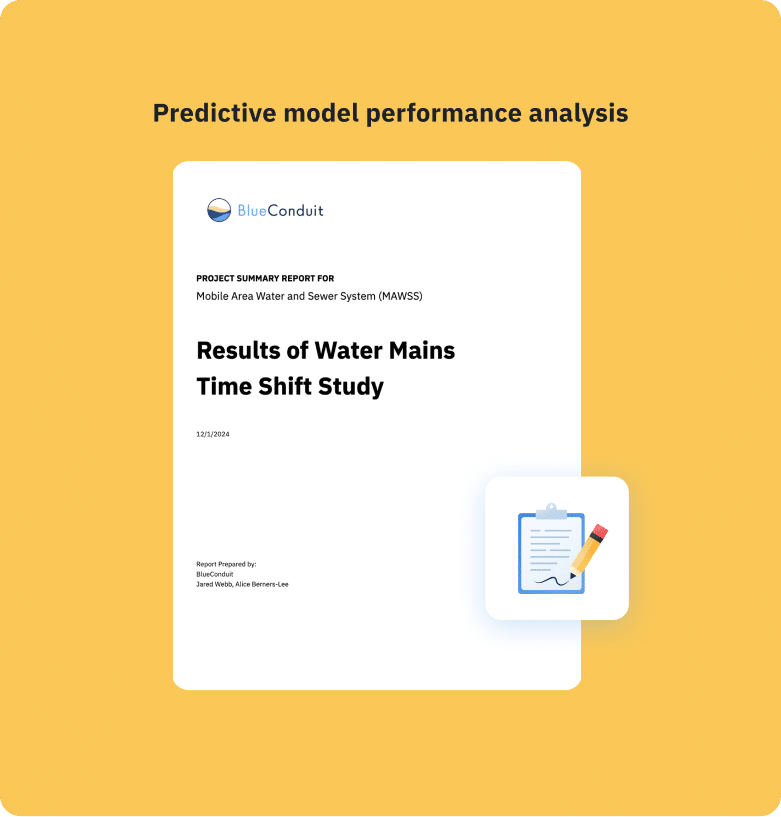
Reports
Simple reports to help you understand your data and BlueConduit’s data science results:
Simple reports to help you understand your data and BlueConduit’s data science results:
- Data Analysis Report
- Time Shift Study
- Methodology & Results Report, annual
Customer success
BlueConduit’s team is committed to your success and highly engaged as you use our tools:
BlueConduit’s team is committed to your success and highly engaged as you use our tools:
- Implementation support
- Ongoing support conversationsv
Data dashboard
View and dynamically interact with your up-to-date water mains dataset:
View and dynamically interact with your up-to-date water mains dataset:
- Interactive map view & tools
- Interactive table view & tools
- System health indicators
- Break history metrics
- Interactive charts
- Data layers include, but are not limited to:
- Water main data
- Break history
- Criticality
- Filter and sort by multiple factors including, but not limited to:
- Diameter
- Material
- Install date
- Criticality
Predictive modeling
Enhance your understanding of water main risk with high accuracy likelihood of failure predictions:
Enhance your understanding of water main risk with high accuracy likelihood of failure predictions:
- Likelihood of failure (LoF) predictions for every water main for multiple timeframes using BlueConduit’s state-of-the-art machine learning models
- Ongoing, dynamic prediction updates
- Prediction explainability, systemwide
- Prediction explainability, by water main
Predictive dashboard
View and interact with your dynamically up-to-date water mains likelihood of failure predictions
View and interact with your dynamically up-to-date water mains likelihood of failure predictions
- Predictions with explainability, bucketed by LoF percentile (Top 1%, 5%, etc)
- Prediction change-over-time assessment and explainability
- Break history metrics (interact, filter, sort)
- Map view (interact, filter, sort)
- Table view (interact, filter, sort, export)
- Filter by multiple factors including, but not limited to:
- Diameter
- Material
- Install date
- Criticality
- Compare predictions to multiple baseline models including:
- Historical breaks only
- Water main age only
- M-77 LoF weighted model, with weighted assigned via machine learning models
Reports
Simple reports to help you understand your data and BlueConduit’s data science results:
Simple reports to help you understand your data and BlueConduit’s data science results:
- Data Analysis Report
- Time Shift Study
- Methodology & Results Report, annual
Customer success
BlueConduit’s team is committed to your success and highly engaged as you use our tools:
BlueConduit’s team is committed to your success and highly engaged as you use our tools:
- Implementation support
- Ongoing support conversationsv