Editor’s note: BlueConduit recently hosted a webinar around the process of using predictive modeling to classify unknown service lines. In this series, we detail some of the questions we received.
Machine learning and predictive modeling are new for many water systems. And there is a lot of new language you need to learn to understand if a model is giving you good results.
You’ve probably heard a lot of talk about “confidence intervals,” and specifically the need for “95% confidence.” At the same time, you might have also heard about “thresholds.” For example, you might hear that a water system is classifying service lines as lead if they have an 80%+ likelihood of being lead.
Let’s explore the confidence intervals and thresholds to understand what each term means, as well as where and why they are important.
Are confidence intervals and thresholds the same thing in statistics?
No, they are not. Let’s break down the two terms and their definitions.
A confidence interval (CI) is a range of values that shows how sure we are about an estimate. For example, if a nutritionist says, “An adult needs between 2,000 and 2,500 calories per day to maintain weight, with 95% confidence,” that means they are fairly sure the actual calorie needs fall within that range. Confidence intervals help us understand uncertainty and make better decisions with data.
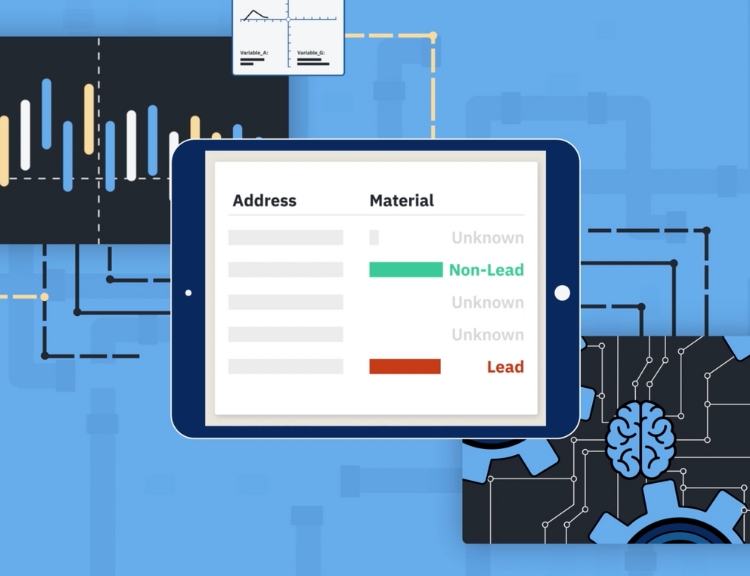
On the other hand, thresholds put predictions into groups (ex, 1-10%), and make assumptions about that group of predictions as a whole, based on the dataset. So, in the case of lead service lines, you might say that all service lines with a 70%or higher likelihood of lead will be grouped together and classified as “Lead” in the service line inventory.
Does a predictive model have a confidence interval?
Yes and no. Every performance metric in a predictive model has its own confidence interval. It is important to make sure that confidence intervals are high across multiple performance metrics in a predictive model to ensure that confidence in model performance.
However, there is no single confidence interval for the full predictive model, because there is no 1 metric that accounts for total model performance. Learn more about 95% thresholds and modeling metrics in the video below!
Watch the full video and learn how to classify unknown service line materials as Lead or Non-Lead with predictive modeling.
If there’s no confidence interval for the full predictive model, how do I trust the threshold decisions?
At BlueConduit, we first make sure that all metrics in every predictive model have a 95% confidence interval. When we make threshold decisions, we look at a variety of performance metrics and local realities to find the thresholds that are statistically defensible and make the most sense for that particular system. We then support the water system in understanding the options and making the decision.
For example, if a water system is very scared of missing a single lead pipe, they’d likely want a larger threshold for classifying lead lines, maybe 50%+. This means they are willing to accept more false positives (classifying non-lead as lead) to ensure they don’t miss any actual lead lines. Conversely, a system less risk-averse might use a smaller threshold.
Confidence levels and thresholds are both important when it comes to using predictive models for service line classification. And, for the purposes of material classification, it is really thresholds that allow a water system to classify its unknowns as lead/GRR or non-lead.
For more insights into BlueConduit’s process for using predictions to classify unknown service lines, check out our on-demand webinar.