Whether water utilities are using statistical analysis to demonstrate no or low lead in their systems, or driving lead likelihood predictions for individual service lines, statistical best practices dictate that they need a representative data set to help train the model. What does that mean, exactly, and how does it work?
At BlueConduit, our approach is simple: Based on the data you give us, we formulate a unique model for your community designed to help you easily identify and prioritize where lead service lines exist so you can make informed decisions about how to replace them. In order to do this, we ask our clients to complete a small, representative sample of field verifications to verify the material of the lines on both the public and private side of the line. This inspection list is generated using existing water system and asset data, enriched with other demographic datasets, in collaboration with the water system.
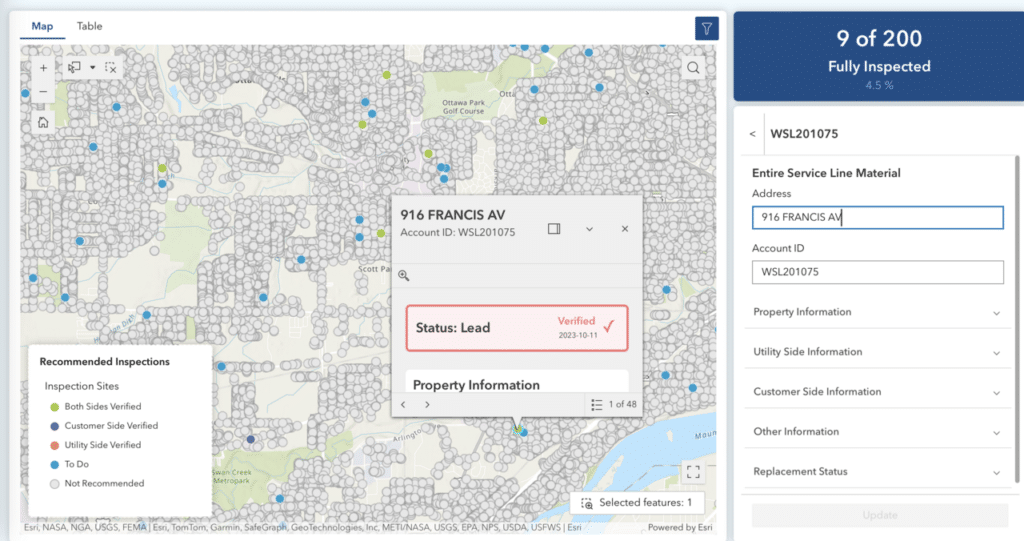
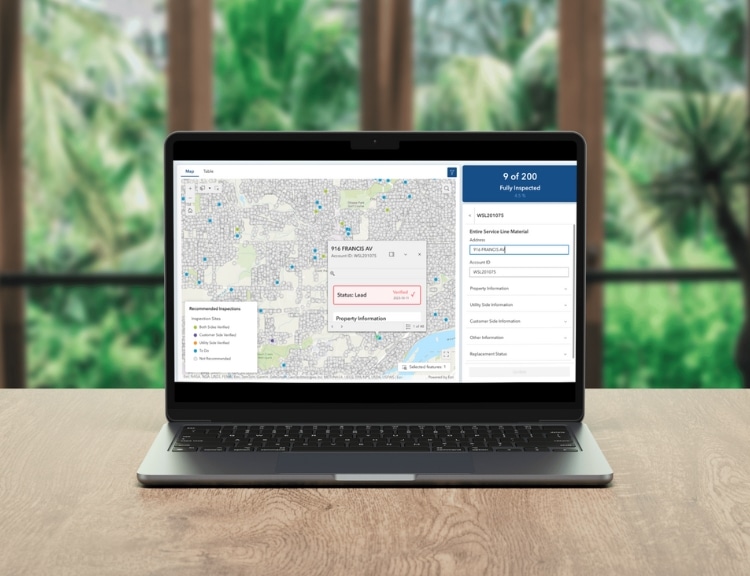
BlueConduit’s Inspection Manager tool helps water systems efficiently manage their inspections and communicate effectively with their teams. Below, we outline a few key benefits and features of this tool you may not know about.
Built within the Esri platform
Our Inspections Manager is layered directly within the Esri ArcGIS platform and LSLI Solution, so as you complete your inspections, you can input and view your data without needing to incorporate other data formats, such as a PDF or spreadsheet. You can easily view everything you need within a single source of truth. Bonus: This integrated experience within Esri also allows for streamlined data collection in the field, using Esri’s LSL Field Map application, where logged inspections are automatically synced to the inventory data. Field workers can mark locations, add notes or take photos on the maps, even if they don’t have internet access.
Complete your inspections in batches
Whether you need to complete 25 or 250 field verifications, the number of inspections to do can feel overwhelming and be spread out across a wide geographical area (to eliminate data bias). BlueConduit’s Inspection Manager tool divides your inspections into smaller groups, or batches, so you can more easily manage them and send appropriately sized teams to complete the work. This also allows for phased inspections. The Inspection Manager also tracks your progress throughout the entire inspection process or by batch – whichever you prefer.

See recommended and non-recommended lines for inspection
While the Inspection Manager tool is designed to help water systems verify specific recommended service lines, sometimes that’s not possible. Whether the line is blocked by trees or the homeowner is unwilling to give permission to access their property, you may not be able to verify the lines as outlined by BlueConduit. Not to worry – you can easily toggle to view lines that are not recommended for verification so you can identify nearby lines (perhaps the next-door neighbor is more cooperative) to verify instead.
Customize your view
Are you a visual person? Or more of a list lover? With the Inspection Manager, you can have your cake and eat it, too. Choose from either map or table view to see your recommended inspections and add filters such as sensitive population (e.g., daycares or nursing homes), address, or install date. We understand people have many preferences when it comes to viewing their data, so we strive to be as accommodating as possible.
Expert support
Getting started with an inventory process is a huge undertaking and inspections, no matter how many or few you have to complete, cost money and time. Our data scientists are here every step of the way to help you understand the methodology behind our predictions and why we’re making the recommendations we are.
Further questions about how our Inspection Tool works, or curious to see it for yourself? We’re happy to help – just reach out and we’ll answer your questions!


