We all want to make more data driven decisions, but it can often be tough to effectively use the data you’ve already got (let alone enhance it with predictive modeling or other tools).
Two of the biggest data obstacles we see when we start working with new customers are non-standardized data sets and difficulty integrating multiple datasets into the same place. What exactly do we mean here?
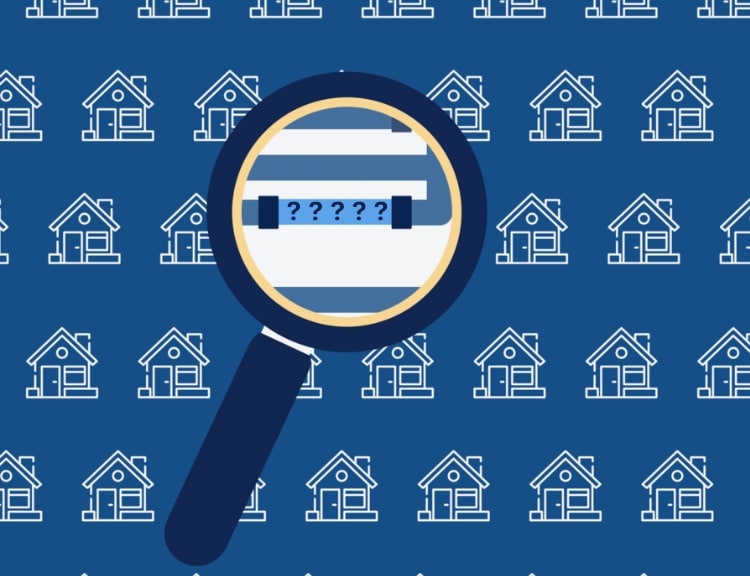
Non-standardized data sets don’t have consistency across all of their data. For example, let’s say you want to filter your data to only look at water mains made from copper materials but your data labels copper as both “Co” and “C.” It is difficult to use your data for analysis without first going through a standardization process to make sure you’re accounting for all copper lines.
Now, let’s say you want to see how many breaks you’ve had across your copper water mains. If your materials data is in a separate data file or tool than your break data, it will again be difficult to use them together for analysis. And for utilities and/or or engineering firms that manage multiple systems, this problem only gets more complicated.
At BlueConduit, we know the power of standardized, integrated datasets to use for analysis, modeling, and decision making. While utilities use many different data schema when it comes to water main management, we encourage our customers to consider Esri’s ArcGIS Utility Network solution schema for water mains management. Let’s explore a few reasons why.
Integrate & standardize your water network data in one place
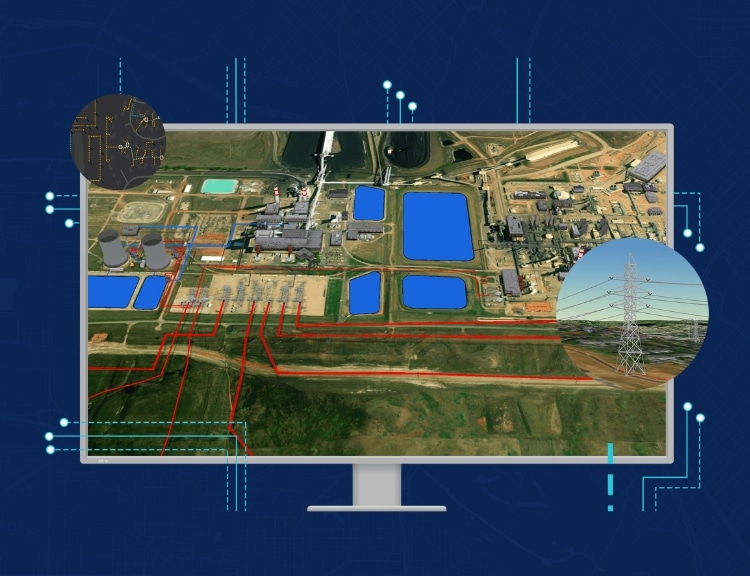
The Utility Network solution standardizes data schema and moves all of your utility network data into 1 unified location. Taking advantage of the newest industry standard helps with the challenges of data standardization and integration described above.
Utility network data is available to all users on any device, in the office or in the field. And the industry-specific data models are built to ensure data integrity and completeness to give you essentially a replica of your complete water (or wastewater or stormwater) system in data form.
Utilize Esri advanced functionality
Unifying your network data into the utility network solution unlocks additional advanced functionality to help you more proactively and efficiently manage your water network. Let’s look at tracing analysis as an example.
According to Esri’s 2022 technical paper “Understanding ArcGIS Utility Network: A Guide for Water Utilities,”
“[T]racing analysis can identify the valves that need to be closed to isolate an area in the event of a water main break. This can be done from the office or the field. Tracing analysis can also be used to identify customers and hydrants affected by water outages… This out-of-the-box tracing functionality removes the need for stand-alone tracing services that lack real time updates to network data and require regular maintenance.”
BlueConduit will help you migrate your water mains data
Whether you’ve got a full migration planned or it is just something you are considering for the future, BlueConduit can help you get started. As part of our Water Main Predictions solution, BlueConduit easily automates the migration of your existing water mains data into the utility network schema. (note that the utility network schema is a recommendation but not a requirement for our Water Main Predictions solution)
In addition, we’re then able to deliver our solution directly into the utility network environment. This means that you can then access BlueConduit’s predictions and tools within the utility network solution, making the advanced functionality even more robust and useful to you for proactive risk assessment and planning.
Want to learn more about pairing our Water Main predictions with a transition to the utility network solution? Reach out to schedule a consultation with our experts today!
Curious to learn more about predictive analytics for water main management? Sign up for our monthly newsletter.


