
Every community wants to find and remove every lead water service line in their water system. The necessary first step is creating an accurate lead service line inventory (LSLI), so that you know where to dig, and can properly prioritize where to start.
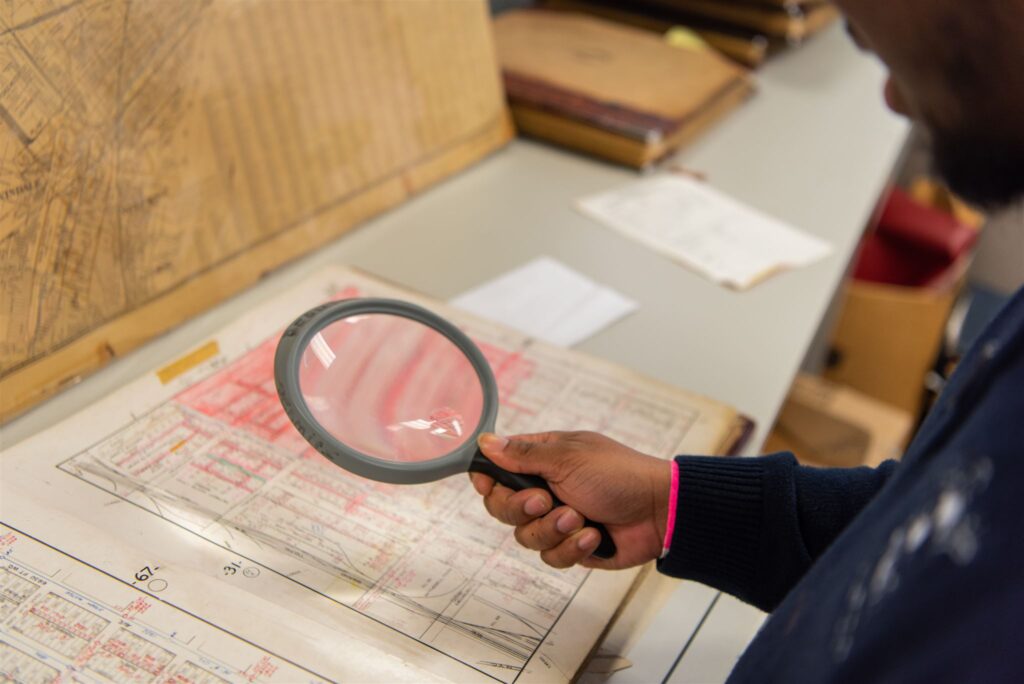
But creating that inventory is extremely tricky. Most utilities and municipalities have to deal with a hodge-podge of record keeping systems and formats, from antique hand-written tap cards and historical maps to abandoned data formats on obsolete digital media. These records tend to be incomplete, inconsistent, out-of-date, or otherwise inaccurate.
Since visually inspecting every service line is prohibitively expensive, communities must rely on sampling: inspecting a subset of all service lines in order to begin to make useful educated guesses about the larger truth of the entire water system.
But inherent in sampling is the potential for sampling bias.
Bias has many meanings; the word alone often triggers an intense emotional response—with good reason. Here, we want to talk about bias in the very narrow sense of “an unintended systematic distortion of a statistical result due to factors not properly accounted for.” A sampling method is “biased” if it systematically favors some factors over others.
Sampling bias makes it challenging to generalize from our sample to the larger population. This is why it’s so important that water systems can recognize and address sources of bias in their lead service line (LSL) inventory process.
Fortunately, with a little care (and proper statistical tools) we can mitigate sampling bias.
Three Types of Sampling Bias Common in LSL Inventory Projects
There are many types of sampling bias, but there are three that seem to be especially common in lead-service line inventory and removal projects:
- Undercoverage Bias
- Participation Bias
- Survivorship Bias
Understanding these three biases is an important first step toward ensuring you gather a representative sample as you prepare your LSLI.
Undercoverage Bias
Undercoverage Bias occurs when we use methods of sampling that ignore part of the population. For example, a Facebook poll will fail to find anyone not already on Facebook.
In LSLI projects, Undercoverage Bias often appears as spatially clustered sampling, for example, when relying too heavily on service-line material observations made during routine maintenance and repair. Tobler’s First Law of Geography reminds us that “Everything is related to everything else, but near things are more related than distant things.” If we replace a water main and find that none of the observable service lines are lead, that’s excellent news for those houses. It’s also an indicator that we may have good news for the surrounding houses. But it tells us less about the larger water system.
Participation Bias
Similar to Undercoverage Bias, Participation Bias gives us too narrow a view of the system. In this case, we miss large portions of the population because participants can select to be (or not be) part of the sample. This skews the sample, since the reasons people chose (or refuse) to participate are usually interrelated with other important factors in their lives.
For example, having employees voluntarily participate in a survey about their workloads will likely result in an under estimation of how busy everyone is, since the people with the heaviest workload are also the least likely to have time to take a survey.
There are several ways that we’ve seen Participation Bias complicate LSLI projects. For example, not being able to inspect an address because the property owner has chosen not to cooperate. Here, Tobler’s Law can be used to your advantage: talk to a neighbor, and you can likely get an approximation of the data we wanted from the desired address.
The opposite—”inspection-on-demand,” where we promote a program for residents to request an inspection, rather than asking for cooperation and risking rejection—similarly biases the sample. People who have the capacity and wherewithal to choose to participate will be over-represented in the sample, which will tend to leave more vulnerable populations (e.g., busy households full of children, households with communication barriers, the economically disadvantaged, elders) under-represented.
Sometimes, eager to move an LSLI project forward, municipalities or utilities respond by leaning on their social and professional networks. This is called convenience sampling, or “friends-and-family surveillance”: we can’t get property owners to embrace the project, and so we ask our friends, family, and employees to participate. This will tend to bias the sample toward specific zip codes, income brackets, racial or ethnic groups, types of household, and so on—once again raising the likelihood that we’ll miss the most vulnerable groups.
Survivorship Bias
With Survivorship Bias, we overlook failures and problems because we place too much emphasis on “survivors” and successes. The classic example of this is the work of Abraham Wald and his Statistical Research Group (SRG) at Columbia University during WWII. The SRG was tasked with determining the most efficient way to reinforce the hulls of aircraft. Looking at the pattern of bullet holes on planes returning from successful bomb runs, officers reasoned that they should simply reinforce those sections of the hull that took the most hits—mostly on the wings, tail, and fuselage. Wald disagreed: they were only looking at the planes that made it back, the survivors. By definition, these planes had sustained no critical hits. Instead, Wald advised they armor the engines—where none of the returning planes had damage—correctly reasoning that planes that took a bullet to the engine did not survive.
In an LSLI project, Survivorship Bias tends to show up in how data is handled over time. Many communities overwrite records after replacing a service line, deleting the old service line record and then adding in a new record with the updated material. This practice robs us of data we can use to generate a more complete profile of what properties with lead service lines “look like” in that specific community, as well as data we could have used to determine where to look for more lead. Remember Tobler’s Law? If we knew there was once lead at a given address—even though there’s no lead there now—then we’d know that it is more likely that adjacent properties may still have lead service lines.
A Biased Sample Can Still Be Useful
A biased sample is still a sample, and can be useful, provided we understand what biases may have been at play. It is still possible to draw valid conclusions from biased samples, depending on the extent of said biases. Statisticians have developed many methods to address sampling bias. A few of these methods most pertinent to a utility working on their LSLI include:
- Geostatistical declustering—Weighting the importance of various points within a sample can compensate for how those samples are geographically clustered and thus simulate a broader geographical sample.
- Resampling—We can create several new samples based on one observed sample, taking different assumptions into account.
- Importance weighting with covariate shift adaptation—This is a mathematically rigorous method of compensating for bias in machine learning classification tasks, allowing statisticians to get the most out of the existing sample.
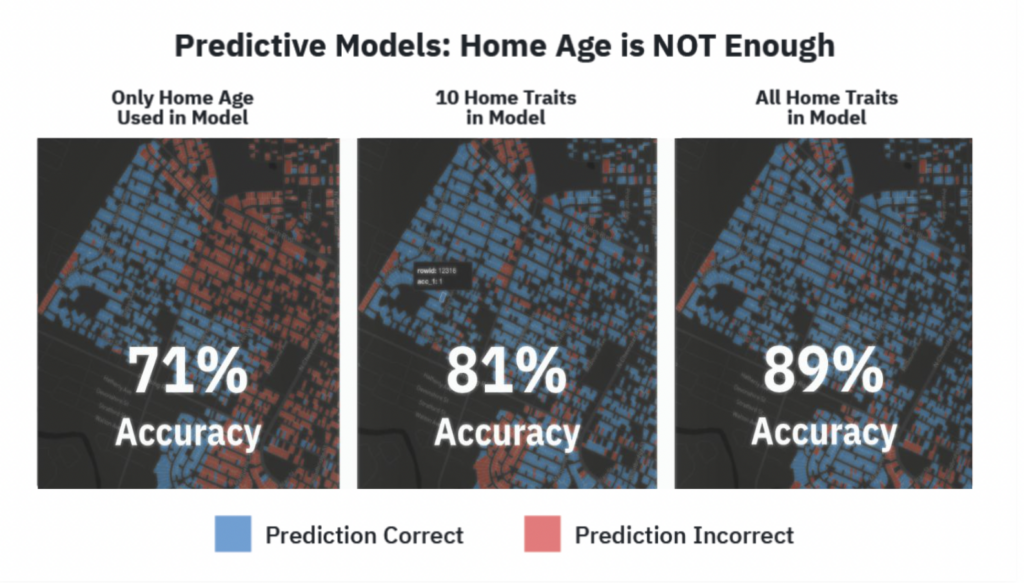
BlueConduit uses these and other tools to tune their algorithms and get excellent results. For example, this set of images shows maps predicting the location of lead service lines in Flint, MI. The percentage on each is an accuracy score, reflecting how often the predicted service line material match what a utility worker directly observed upon inspection. The first map (far left) relies on simple home age to predict service line material. As BlueConduit applied more features to the model (including other data points and statistical methods and tools like those listed above), the accuracy score significantly improved.
How to Minimize Sampling Bias in your LSL Inventory
The following practices will help you avoid sampling bias during your LSLI process:
- Focus on transparency and community engagement—Trust is the foundation of participation/cooperation. Invest time and resources into meeting the community where they are, addressing their concerns, and finding innovative ways to work together as partners. The Detroit Water and Sewerage Department has been broadly recognized for their successes in community outreach and engagement.
- Do not accept historical data as ground truth—”Historical Records” are not “Verified Records.” They are a useful starting point, but should be treated with caution.
- Adopt good data management practices—Make sure all data is preserved, well organized, and in compatible formats. Bring new data into your model as it becomes available.
- Inspect service lines at a representative set of parcels—Carefully select parcels for sampling in order to build a representative sample (as opposed to a convenient one). A representative sample accurately reflects the entirety of the service area.
- Use statistics to support your decision-making processes—Good statistical modeling goes hand-in-hand with good field work. BlueConduit works with communities to bring together their existing data, their most recent field inspections, and the right combination of statistical and machine-learning tools to iteratively and collaboratively create the most accurate LSLIs.