


Now that the EPA has included statistical prediction as a service line investigation method, it’s worth considering what makes a “good” prediction. Like so many things, there are trade-offs and choices to be made. One choice is the prioritization of precision and recall. It may sound pedantic, but it matters for real-world outcomes.
Measuring the accuracy of a prediction can be fraught with peril. A few wrong assumptions combined with a poorly understood measurement tool can lead us to think that we have achieved great success, while in reality we are completely missing our goals.
Let’s drive this home with an example of how things can go awry. Suppose that I am asked to find out who has a rare disease in a population of 1,000 people. If only 1 person in that 1,000 has the disease, then I can just say that no one is sick, and pat myself on the back for getting 99.9% of diagnoses correct. In reality, I have missed the target completely.
On the other hand, I could say that every single person DOES have the disease. In this case, I have definitely found the thing I’m looking for (100% of cases were found!) while similarly providing no useful information.
The Precision-Recall Tradeoff
Assessing the accuracy of a prediction, especially of a rare event, should never be reduced to a single number or metric. Consider our disease case in the previous paragraph: our two very different all-or-nothing prediction strategies were “successful” in some measurements, while dismal in others. These extreme (and unrealistic) approaches demonstrate worst case scenarios in what is called the “Precision-Recall Tradeoff.”
Any user of statistical tools should have a basic understanding of this tradeoff. Let’s get there by first defining some terms:
Precision
In a model that predicts a binary (Yes or No) outcome, the precision of a prediction from that model is the number of successful “Yes” predictions (Predicted “Yes” is found to be Yes, or True Positives) divided by the total number of “Yes” predictions (True Positives + False Positives). This is also known as the hit-rate or specificity of a model.

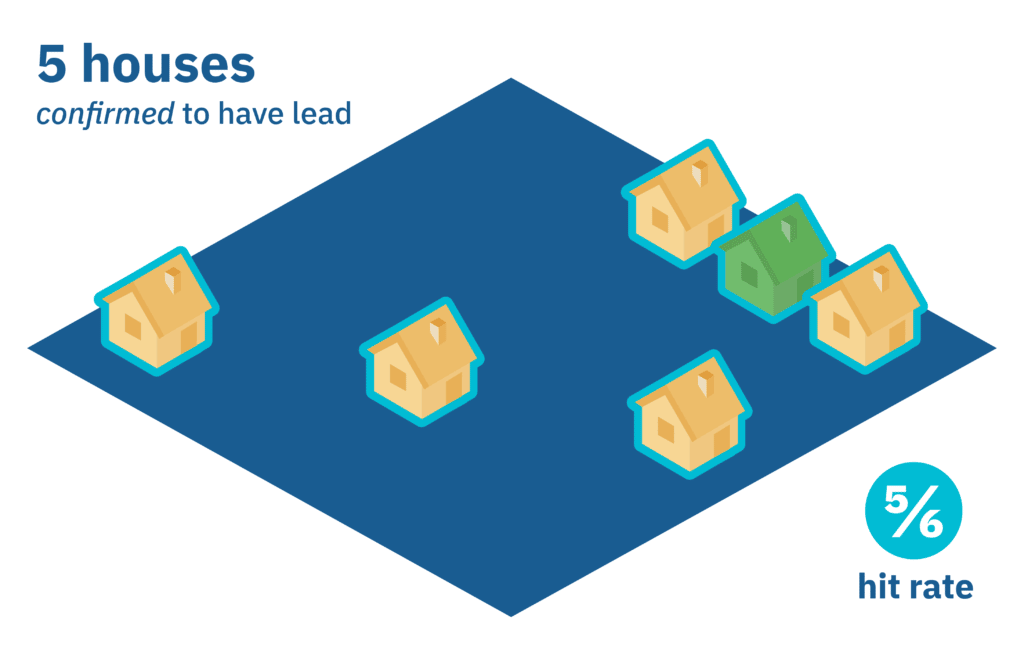
When we want to find lead service lines, a high hit-rate is an important measure of success! It means that you are spending more of your resources getting the lead out of the ground and improving public health. However, if it is our only measure of success, we are limiting ourselves and are perhaps blind to lurking hazards.
Recall
Enter recall, also known as sensitivity in statistical circles. Given our same model as the previous section, the recall of a model is the number of successful “Yes” predictions (True Positives) divided by the total number of Yes labels (True Positives + False Negatives).
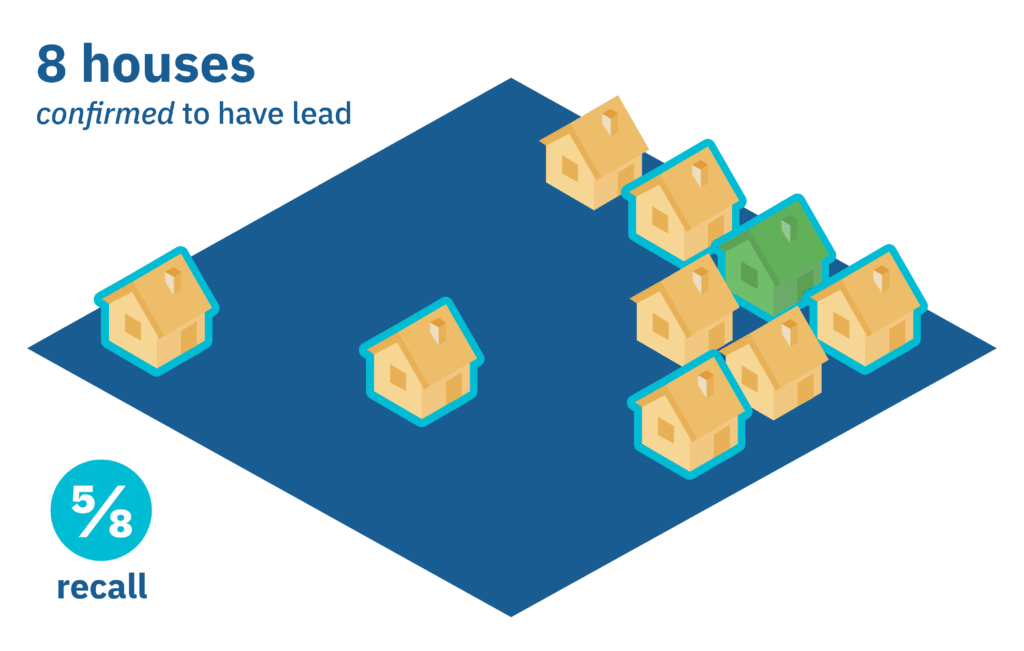
In the fight to replace lead service lines, recall is a very important metric to consider. Low recall can have tragic consequences, where a community may think they are free from a lead hazard when it is, in fact, exposed.
Are there parts of your service area where there might be lead, but you aren’t attempting to conduct replacement efforts due to uncertainty? Could there be neglected areas, maybe with poor data, that aren’t getting prioritized that may have lead service lines?
Recall is particularly troublesome because you don’t really know what your true recall is until every single service line with unknown material is excavated and verified. Since we don’t have access to that information, at BlueConduit, we make use of statistical tools to continuously monitor and estimate the recall of our models. High recall models are typically based on unbiased, representative data.
There’s Always a Tradeoff
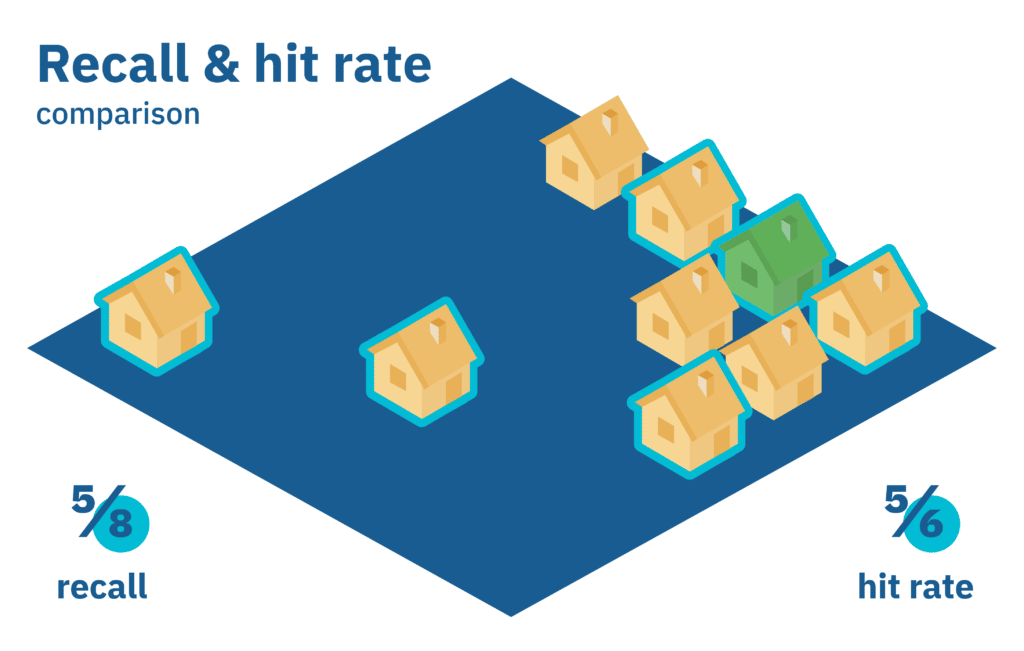
A perfect model will have perfect precision and recall scores. Of course, we don’t live in a perfect world, and we certainly don’t have perfect models. In the real world, we must deal with uncertainty. When we are finding lead service lines, there may be some “low hanging fruit,” where we are very certain to find the lead and enjoy very high hit-rates. But what happens when we exhaust the easy to find locations? At that point, we begin to deal with more and more uncertainty, and typically our hit-rate drops as we seek to eliminate the remaining lead service lines, while at the same time our recall continues to increase.
Life is often about trade offs, and
LSLR programs are no exception.
We can have a higher hit-rate or precision at the expense of lower recall, or we can increase our recall by sacrificing our hit-rate. What we shouldn’t do is try to ignore the trade-off, or pretend it’s not there, but rather acknowledge it and make the decision that makes the best use of the resources available to your community.
Learn more about how BlueConduit Predicts Lead Service Lines: How it Works. See other posts written by and about Jared Webb.