
Data Sources for LSLI and LSLR
BlueConduit has a fundamentally data-driven approach to lead service line inventory (LSLI) and removal (LSLR).
Our statistical models perform best when they have high-quality water system data to work with.
What is the Most Important Water System Data for an LSLI/LSLR Project?
In our experience, it varies from community to community what data is most predictive. That’s why BlueConduit embraces a collaborative, iterative approach. We work with communities to make the most of the data sources they have and combine these with other sources available to us through public agencies and private partners (e.g., the Census bureau or State GIS agencies) to begin to cultivate a model that can then generate a good starting LSL map and develop a sense of what a house with lead service lines “looks like” in your community.
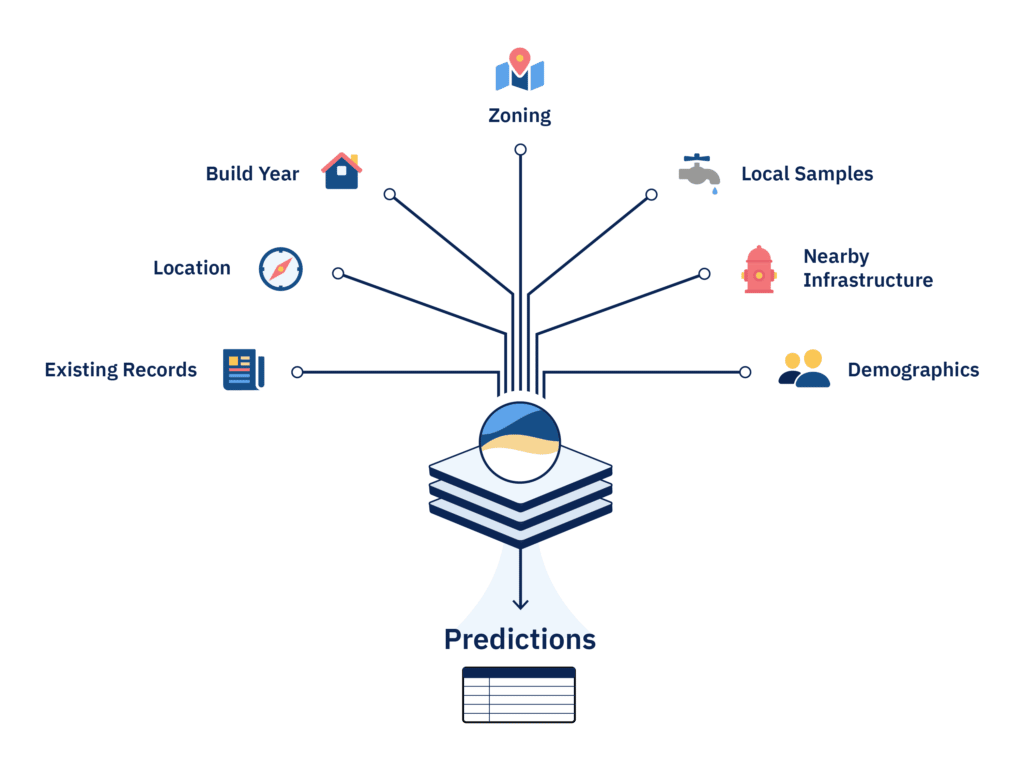
The most common initial data types we use include:
- Existing service line inventory and parcel data: These are very often the most valuable data, even when incomplete. Our data scientists will use these to establish a “service line footprint” for your water system. We can then begin to fill in this map with historical data, information about each building age and use (residential/commercial), and so on.
- Material data: Information that gives clues as to the service line material. These might include surveys of residents, asking them about the lines connected to their water meter (such as checking if these lines can be easily scratched with a house key or if a magnet will stick with them). Hydrovac inspection data, data from water tests, and records of violations issued by the EPA or other agencies can also help determine where lead service lines remain in your water system.
- Historical data and work orders: Where has work been done in the water system? Knowing where lead service lines have been replaced helps us know where they still might remain. There can also be other valuable information on work orders. For example, we’ve worked with communities where workers often noted the service line material they observed on the work order itself—information that wasn’t reflected in other records.
- Fire hydrant locations: In many communities, there is a correlation between fire hydrant locations and lead service lines: if one house near a specific hydrant still has a lead service line, it is much more likely other houses within a given radius do as well.
- Census data: Information related to population demographics, education levels, median household income can be very helpful in finding patterns where lead service lines may still be in place.
- Real estate data: Year of construction is obviously a key data point, as no residence built after 1986 will have lead service lines. But an area’s occupancy/vacancy rates, rental prices, median home value, and lot sizes are also often helpful.
Using these and other data, BlueConduit will produce an initial lead service line inventory map for a community’s water system. We can then continue collaborating with that community as they begin LSLR work—and thus collect more data. As we feed our model more, newer, better data, the model’s predictions continue to improve.
What Comes Next?
BlueConduit has been helping water systems identify, prioritize, and replace lead service lines since 2016. Learn more about how BlueConduit’s services work and the timeline and process for preparing your lead service line inventory.
Let us help you plan your LSLR program, inventory your LSLs, and optimize your LSLR efforts.