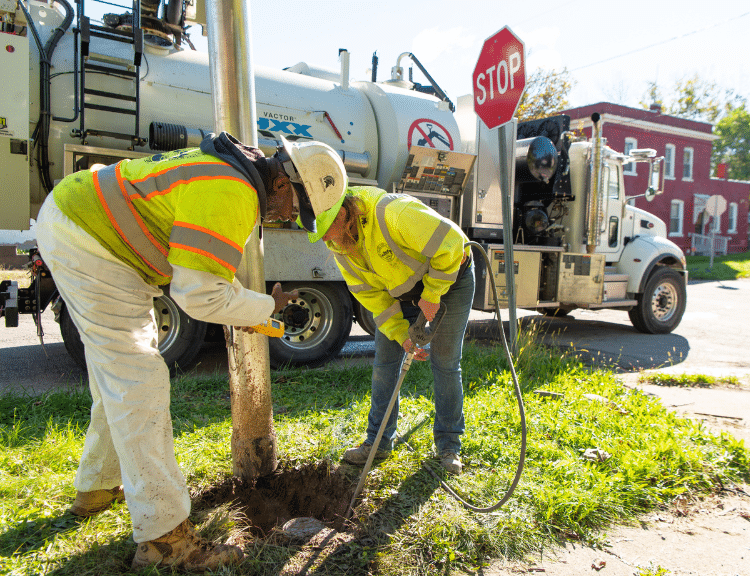
Communities sometimes balk when asked to inspect service lines in order to gather a “representative sample” of their water system for predictive modeling of their service line materials. After all, they already have a recent sample or survey of some portion of their water system. They may have been reassured by some experts that as long as they sample a certain number of their service lines, they can expect an AI-based system to produce a service line inventory that performs well. In light of all that, another round of inspections seems like a time-consuming, nitpicky hassle.
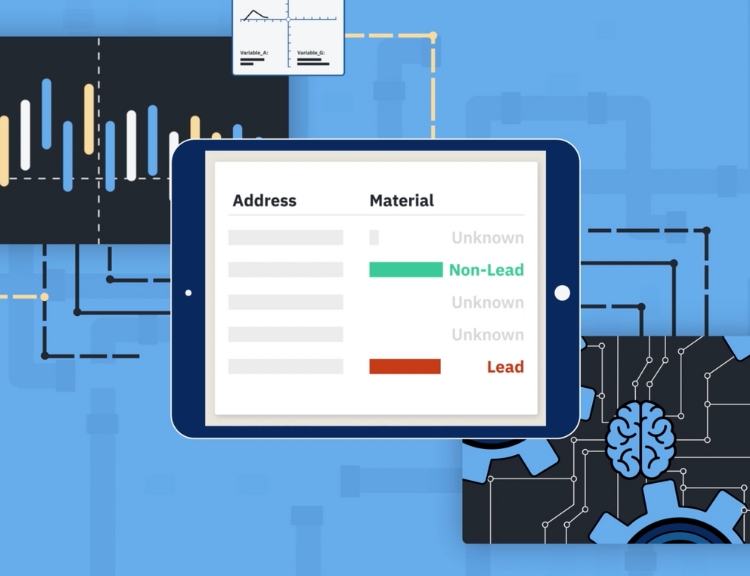
Machine learning and artificial intelligence allow us to get much more out of the data we collect, finding subtle patterns, capturing complex nuances, and using these to build predictive models. This makes it possible to see relationships that are difficult to understand by just glancing at the data.
But in order to reap these benefits for lead service line inventory (LSLI) work, it’s vital to gather a truly representative sample. If we don’t put in the effort to carefully craft a representative sample, we will invariably end up with a statistically biased sample.
To be clear, in this case we’re using the word “bias” in the statistical sense of “a systematic distortion of a statistical result due to factors not accounted for in the sample.“ (More on good sampling practices in data science.)
Bias results in a non-representative sample. Non-representative samples may result in poor predictive models that cannot generalize to the larger population, and may prove misleading.
The Hazards of Non-Representative Samples
There are many ways that good data can be a poor sample. Imagine a community sends out surveys asking customers to check the material of the line connected to their meter. Such a survey gives a great picture of the service line material at the homes of people who replied to the survey—but no information as to why they made the time to reply, and no information about the people who did not (or could not) complete the survey. As such, you could easily oversample certain types of households while entirely missing others.
For example, it may be the case that single-family home renters in these communities don’t have access to their water meter. These renters would ignore that survey, and those properties would be entirely missed. Your survey still gathered good data, from which you can build a good model. But it will only be a model of the neighborhoods dominated by owner-occupied homes, not the entire water system or city.
A non-representative sample can easily steer you in the wrong direction. And if this poor sample creates a “pattern of neglect” in your LSLR program, it can snowball into a public relations nightmare. Worse, it could unnecessarily inflict ongoing lead exposure on members of your community.
In the end, you’ll waste time digging holes that don’t add anything meaningful to your knowledge, or find any lead.
Meanwhile, with a truly representative sample for LSLI, you can get significant findings after just sampling a small percentage of your water system. For example, several of our customers have achieved highly performant models across large systems with relatively small representative samples.
Building Strong Representative Samples for LSLI
Surveys like the one described above—even when they have gaps and “blindspots”—can still enrich the predictive model of your water system, provided you have a good sense of your whole dataset, and start from a strong foundation. A good representative sample is that foundation. Such a sample covers all the types of homes in your water system, while still being as random as possible.
In order to strike this balance, BlueConduit starts by considering geo-spatial relationships between parcels, home values and prices, occupancy, date of construction, and other factors. We then draw in local historical records, surveys, and other more recent data the utility or municipality has collected, weighting them by verified accuracy. Finally, BlueConduit creates a list of parcels where the service line material should be visually verified in order to fill in a few unknowns and further tune how much the other data sources and prior assumptions can be trusted. When possible, communities and BlueConduit collaborate to iterate further, adding more data (and occasionally more visual inspections, as needed) in order to further improve the predictive model.
This process has proven quite effective, reducing LSL inventory and replacement project times by 75% or more.1
1 For example, the City of Detroit reduced its LSL replacement project schedule from 40 years to 10 years. Read more on the Detroit Water and Sewerage Department’s lead service line project on our blog and in WaterWorld.


